
By Russell Rhoads,
head of research
The business networks dusted off the bear market graphics as the S&P 500 officially hit bear market territory on Friday. The chart below uses 15 minutes bars to show the amount of time the S&P 500 was down 20%, since we closed outside the down 20% range when they turned off all the machines on Friday.
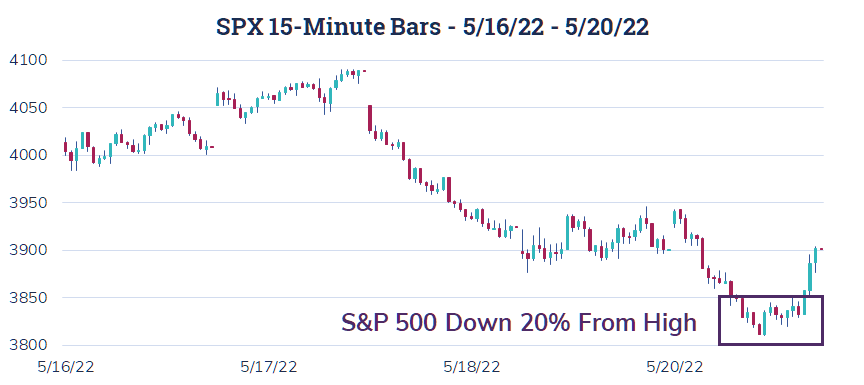
A back of the envelope calculation has SPX below the magic down 20% level for about two and a half hours. We came very close to down 20% the previous week, but broke to new lows this past Friday. However, like when we got close, buyers who were likely waiting for this price level to put money to work took advantage of Friday’s weakness to do just that.
Last week was the 2022 version of EQDerivatives European conference in Barcelona. It was nothing short of wonderful to see people in the third dimension. I also received constructive feedback on these Saturday posts. Since I was in Europe, I received suggestions that I include the Euro Stoxx 50 and associated volatility indices in my recaps. The table below now includes those markets as well as the SPIKE and VSPIKE indices.

There is a lot of red on the table above with only VIX and the SPIKES index moving higher on a week over week basis. VIX under 30, when just hours before the end of the week the S&P 500 was down over 20% off highs, is a bit perplexing. VIX is known as the ‘fear index’. However, to get VIX moving quickly higher there has to be some unanticipated downside price action in the S&P 500. I think there are very few market participants that are surprised when we are having a very negative day for equities in 2022. That lack of surprise keeps VIX around 30 as opposed to much higher levels that accompany a market panic.
The May VIX futures settled this past week bumping June to front month status. On a week over week basis, VIX rose, June was very close to unchanged, and then farther out of the curve prices moved up a bit more. Do note, the range for VIX futures remains very tight all the way out to December where a seasonal anomaly results in an outlier close relative to the other futures.

Another suggestion, on the heels of last week’s focus on SVIX and UVIX in this space is that we include the VIX related ETPs in these Saturday reviews. The table below shows the week over week changes for those various products.

I am not going to dive into the various nuances of these VIX related exchange traded funds and exchange traded notes beyond highlighting what type of exposure each offers in the first column. This colum displays the ETP exposure to each index with ST representing the short end of the VIX futures curve and MT representing the longer end of the curve. Finally, I’m using the week over week closing prices versus NAV to display performance as those are the prices we pay to get in and out of these ETPs.
Moving on to a few trades of interest. On Friday, before we entered bear market territory, there was a large ratio spread that hit the VIX pit. With spot VIX at 28.75 a trader bought 20,000 VIX Jun 24 Puts for 0.66 each and sold 30,000 VIX 23 Puts for 0.40 each resulting in a cost of 0.12 per 2 x 3 ratio spread. The payoff at June expiration shows up below.
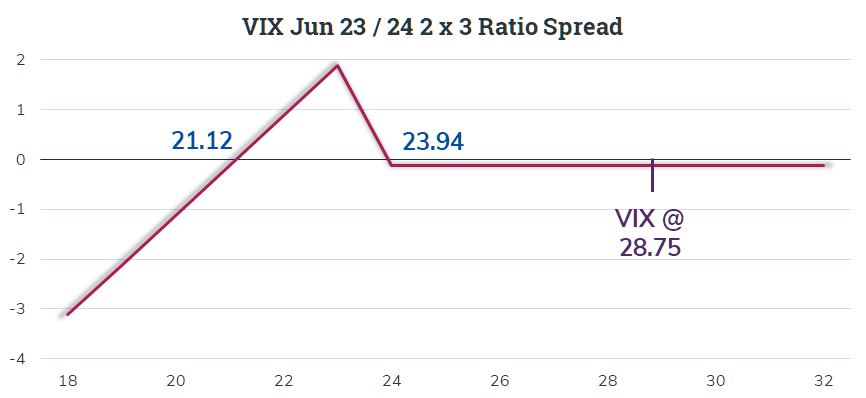
This trade is trying to thread the needle with a narrow range of profitability at expiration (21.12 to 23.94). My assumption is that this trade will be managed if VIX gets to the lower 20’s over the next few weeks.
Another interesting trade hit the tape on Friday, just a few seconds after the market open. Using SPX options a large trade used the standard AM-settled June 17 contracts. SPX was around 3934 as a trader purchased 2550 of the Jun 17th 3950 Calls for 106.03 and the same number of Jun 17th 3950 Puts for 121.03 resulting in a net cost of 227.06.

I have never been a fan of buying straddles and this may be the first time in about a decade of writing up trades that I included one. However, in the current market environement, a rise of over 6.18% or drop greater than 5.37% is not out of the rehlm of possibility.
Finally, again looking at Friday, NDX was around 11575 when a couple of large trades using options expiring this coming Monday, May 23, hit the tape. Both trades sold the NDX May 23 10700 Puts and purchased the NDX May 23 10600 Puts resulting in a credit of 0.95. The risk for this trade is a little steep at 99.05 if NDX closes Monday below 10600.

Breakeven for this trade was down 7.56% when the trade was executed, but NDX rallied a bit finishing the day at 11835. With this strong end of the day, the short strike for this spread is now down 9.6%. This sort of buffer probably gives the trader behind this one a bit more confidence holding it over the weekend.